Ingredients for Tipping Points
Revolutions have a phenomenon of being sparked. There is some event, where what seems like a small event that previously would have had no or small consequences, leads to the roof blowing off. How come that this time in contrast to all previous times there is a dramatic shift? The existence of tipping points does not only apply to revolutions but also to social movements, economies, cultural shifts, technological adoption, and other situations. The general characteristic of a “tipping point” is that even relatively small changes in some inputs lead to big changes in outcomes even if in some prior circumstances they did not. Is there a common mechanism across a range of circumstances leading to the “tipping point” phenomenon? To understand better what might be the origin of these “tipping points” and their nature, we will look into a very simple mathematical model and see that such tipping points arise from two very simple ingredients.
Let us describe first these two ingredients in the context of society through examples: people have inherent individual preferences believing or preferring something, but also people would like to be in alignment with other people they are connected to. These two ingredients are very common. For example - if we believe something to be true or false. We believe something to be true or false due to some of our own personal rationales. However, we are also influenced by people around us - because it is good for other reasons to belong to a group, and agreement fosters a sense of belonging. Or maybe because we believe other people know something we don’t as individually we cannot know everything, and we have people whose opinions we trust. Or maybe because the “tall poppy gets chopped” so we fall in line. Another example is - the goods and brands we purchase. We have our preferences about specific goods, but we glean if something is a good or bad idea based on choices people around us have made - eg. if everyone is buying a certain brand, is everyone else wrong? Or political revolutions - there might be an inherent desire for change in individual people, but as noted previously “tall poppy gets chopped” so there is safety in aligning with neighbors.
We talked about the two ingredients with examples of individual behaviors in society, but let us take technological adoption as another example. Some technology might be beneficial, so there is potential preference in an e.g. organization to adopt the new technology or practice. However, as individuals in the organization making choices there are risks in doing something else than peers. As the saying goes “nobody gets fired for buying IBM”. Another case is the well-known “network effect” - e.g. we might want to leave a social network as we prefer some other one, but if our connections are not there it is empty, so we stay. For example, the Bay Area network effect.
We could keep going, but now that we have seen a few examples, let us describe the ingredients in more abstract terms:
On some individual entity basis there is an individual bias towards a state. But also an individual entity would preferably align with neighbors for some reasons.
The mathematical model
Given the ingredients, we would like to explore the implications. It is time to express the above ideas in a bit more mathematical language. Let us imagine a regular square grid of connected nodes, where each node is connected to its neighbours to the immediate left, right, top, bottom and diagonally [1]. Each node can have one of two states - “yes” or “no”. Each node has a certain probability associated with it that in the next time step, it will flip its state. This probability is proportional to the number of neighbours whose state is opposite to the node’s plus the individual node’s bias in favour of a certain state. This individual bias represents individual preferences and can be different for each node. We also clip the calculated flip probability number to be in the range of 0 to 1. To give a quick example of the calculation, let us say the node is in the state “no” - but 4 out of its 9 neighbours are “yes”, and the individual node has a preference of 1/10 in favour of “yes”. So node has \(4/9+1/10 \approx 54\%\) chance of flipping after a time step. That is the end of our model.
With this model we can set up simulations, where will assign fraction M nodes uniformly and at random a bias (which we will abbreviate with letter B) in favour of “yes” and the rest of nodes same bias B but in favour of “no”, start them all with “no”, and let the simulation evolve for a number of time steps T and record final fraction H of number of nodes in “yes” state. As we run many such simulations, aggregate outcomes for different values of M and plot the median values of H for each M what will we see? A possible quick guess would be - maybe it is a straight line, i.e. H is proportional to M? If fraction M has a preference for “yes”, should we finish with about H number of people saying “yes”? The answer is no as seen from simulations outputs in Fig 1.
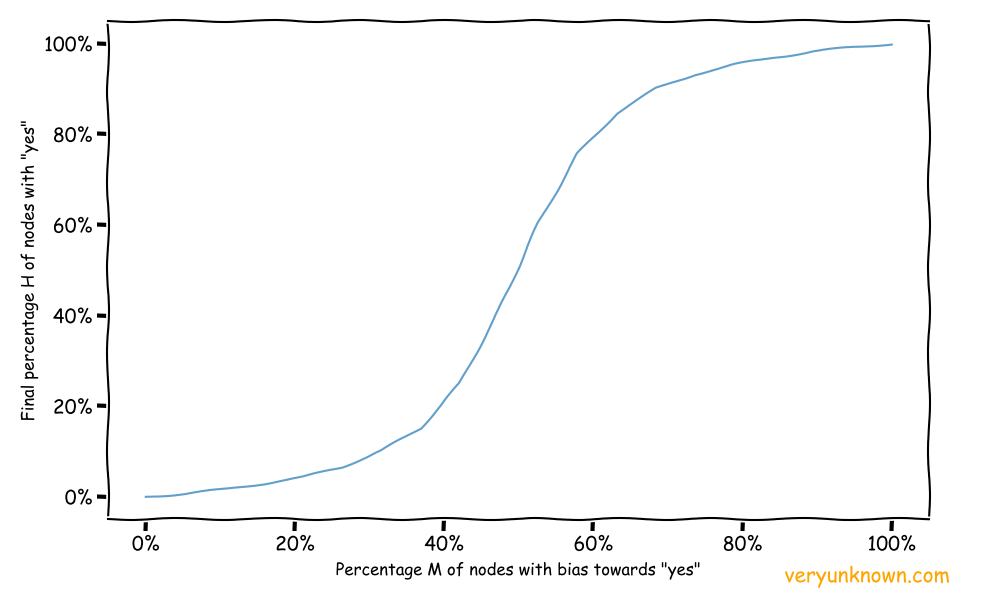
Fig 1. Final median fractions H of ‘yes’ states vs fraction M of biases in favor of ‘yes’
The important thing to note is that while fraction M changed initially from 0% to 40%, the H changed only by 20%. Then next even though M increased by another 20%, the H changed by 60%. A rapid, nongradual change! There was a sharp and rapid shift towards “yes”. This is the emergence of the tipping point - the H values for M range of 0% to 40% is relatively flat, so changes by 20% don’t make a notable difference, but once M gets close to 40% further shifts in M results in big moves in H. The reason for this is pretty intuitive - while M is small it is the neighbors who pull the “yes” nodes back towards “no”, and similarly if M is large, the “yes” nodes pull the “no” nodes towards “yes”. Ie. the neighbors try to pull the outliers into alignment. But in between small M and large M values, there is a rapid transition period.
Some other implications
In the last section, we focused on setting up the model and seeing how the tipping point phenomenon arises. Here we will explore some other implications. Let us take one of the prior simulation runs specifically, with M of about 80% and chart for each time step for each node probability of flipping towards yes or no in Fig 2. Green colours indicate the probability of flipping to yes, blue colours indicate the probability of flipping to no and the intensity of the colour indicates the probability value - the more intense colour, the more probable. This map also allows us to see at each time step the state of the grid - which nodes are in “yes” and “no” states. What we see is that initially the “yes” are lone voices, surrounded by “no” nodes. But as time progresses clusters start to form from where the clusters grow and merge. We see that the model reproduces the frequent observations of how transitions progress - of having trailblazers, cluster formation and their growth.
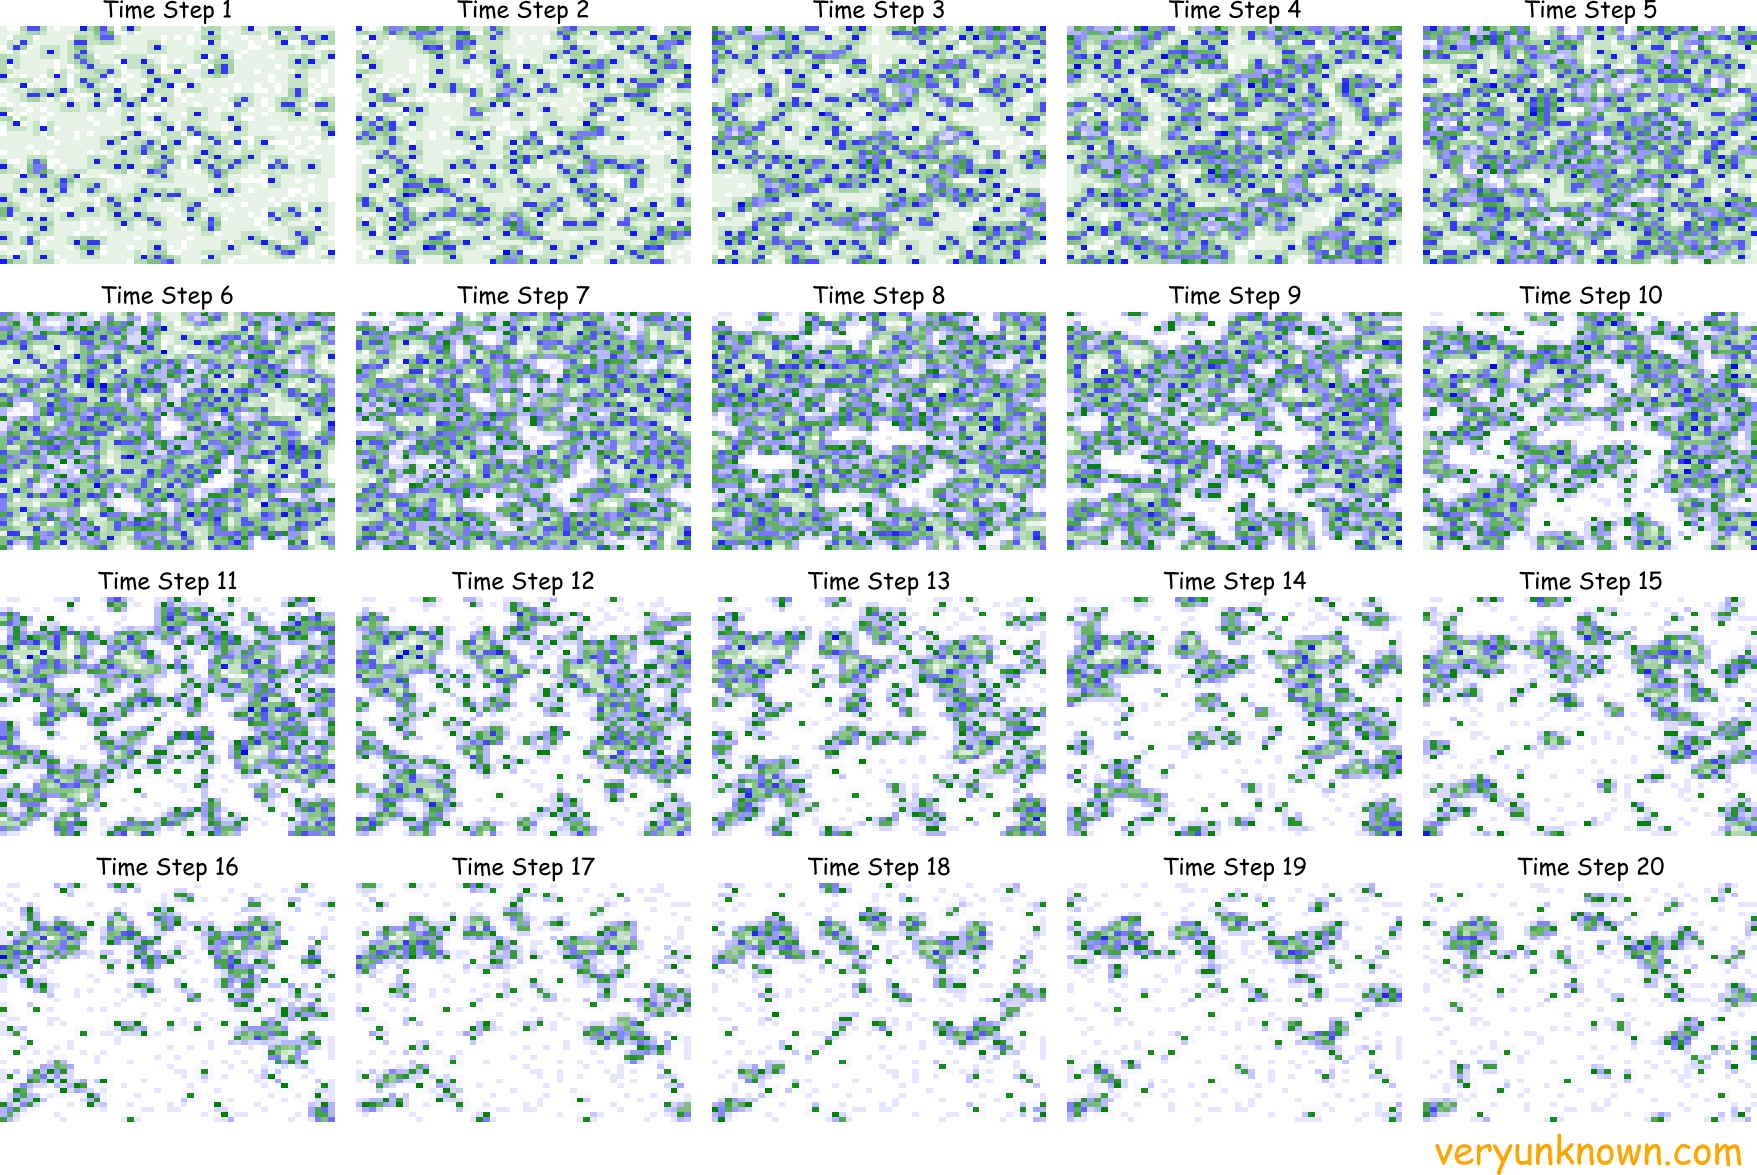
Fig 2. Evolution of probabilities over time
In the previous simulation, we set up that fraction M has bias B towards yes, and the rest of the nodes have bias B towards no. However, what if we try to model that the rest of the nodes are indifferent? Ie. a situation where a minority has a preference, while the majority is indifferent. If we run the same simulations in the same manner as before we can see from Fig 2. that there is no initial suppression period. In simple terms, a determined minority will drag along an indifferent majority. For example, we can see this as an example of some advertising. Many products are pretty similar so paid promoters are a determined minority amongst indifferent majority.
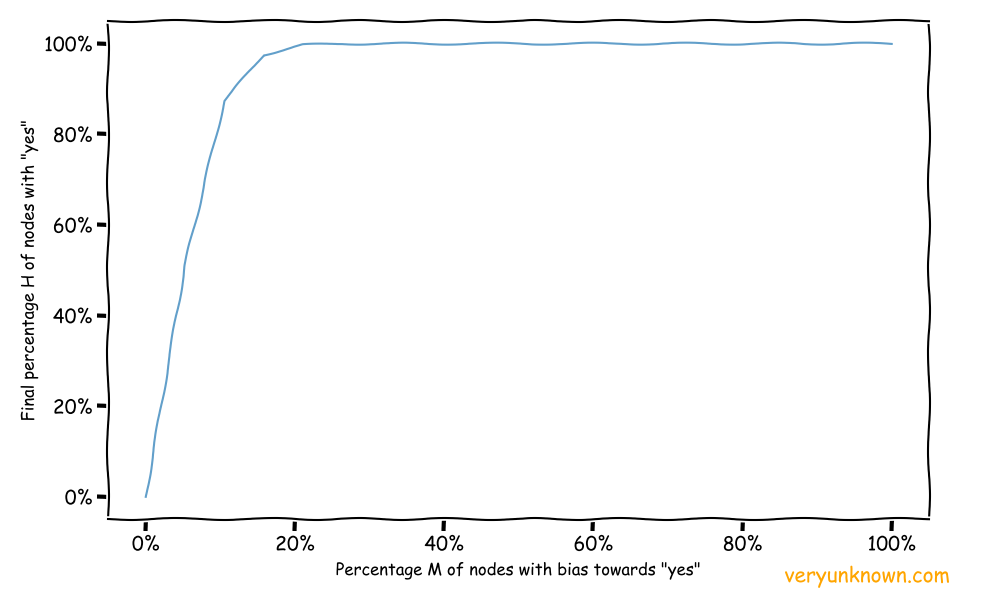
Fig 3. Asymmetric preferences
Another thing to note while we are at Fig 3. Let us imagine the population is indifferent and all say “no”. Then life changes and M shifts to 10% - so now the population is saying “yes”. Life changes again and M’s change their position back to indifference. Note how at the start everyone was indifferent but was expressing “no”, while at the end again everyone is indifferent but expresses “yes”. It is to say that how society is depends on the history of how it got there.
In summary
Clearly, the model above does not capture the full complexity of the real world, but as the saying goes “all models are wrong but some are useful”. The two basic ingredients, the individual preferences and alignment with neighbours, are very simple and can be stumbled into in wide variety of cases, and explains a range of phenomenon.
[1] To avoid having boundaries for simplicity we also assume that the rightmost nodes are connected to the leftmost nodes as neighbors and similar for top and bottom edge nodes